
Scenario:
In an apparel manufacturing factory, the Sewing Line Production process involves multiple departments. These include Production, Quality, Industrial Engineering, Machine Maintenance, and Supermarkets (Fabric & Trims). Key performance indicators (KPIs) like efficiency, productivity, defect rates, downtime, and machine breakdowns are critical for daily management. They are also critical for decision-making. Manual reporting creates inefficiencies, delaying vital production decisions.
Goal:
To streamline production monitoring. To enhance decision-making speed. To remove manual report handling by leveraging Power Platform components (Power Apps, Power Automate, and Power BI).
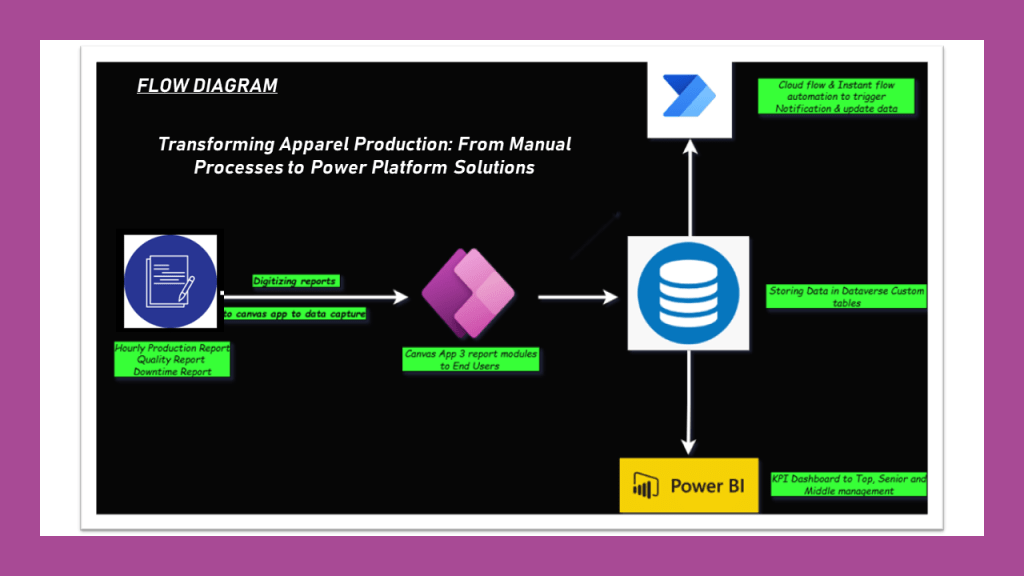
Step-by-Step Solution:
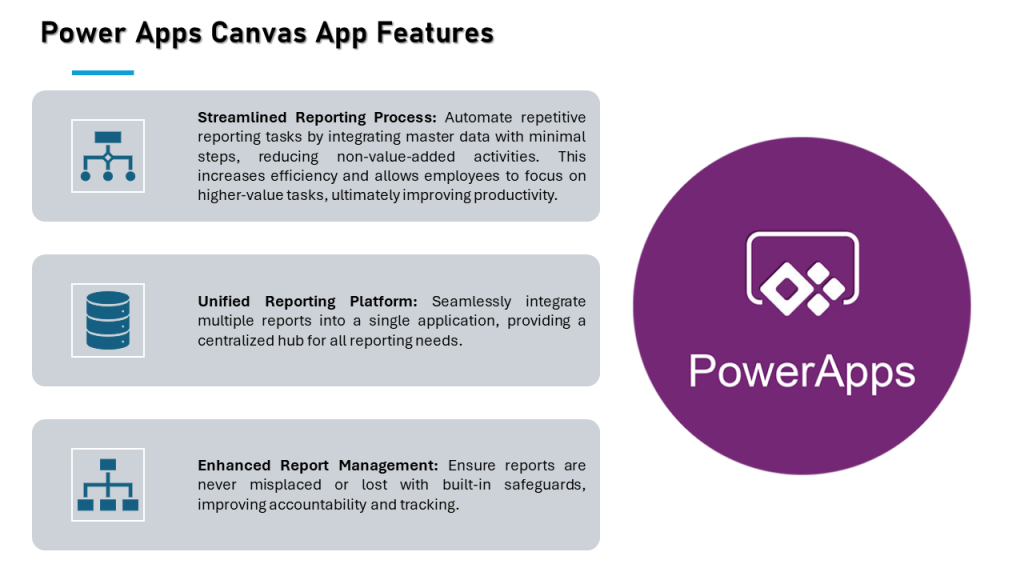
1. Power Apps: Canvas App for Data Capture
Purpose: Replace manual paper-based hourly production monitoring with a digital solution that collects data in real time.
Development: Create a user-friendly Canvas app that supervisors can use to enter hourly production data directly from the sewing floor. The app allows them to:
- Enter operator names, target output, actual output, and any issues like downtime or material shortages.
- Store department-specific data like machine breakdowns or quality rejections in a single app.
- Automate calculations for efficiency and productivity using predefined formulas.
Benefits:
- Eliminates time spent on manual reporting and reduces data entry errors.
- All production line data is stored in one place, accessible to middle management at any time.
- Supervisors no longer need to fill out multiple reports manually, making their tasks quicker and more efficient.
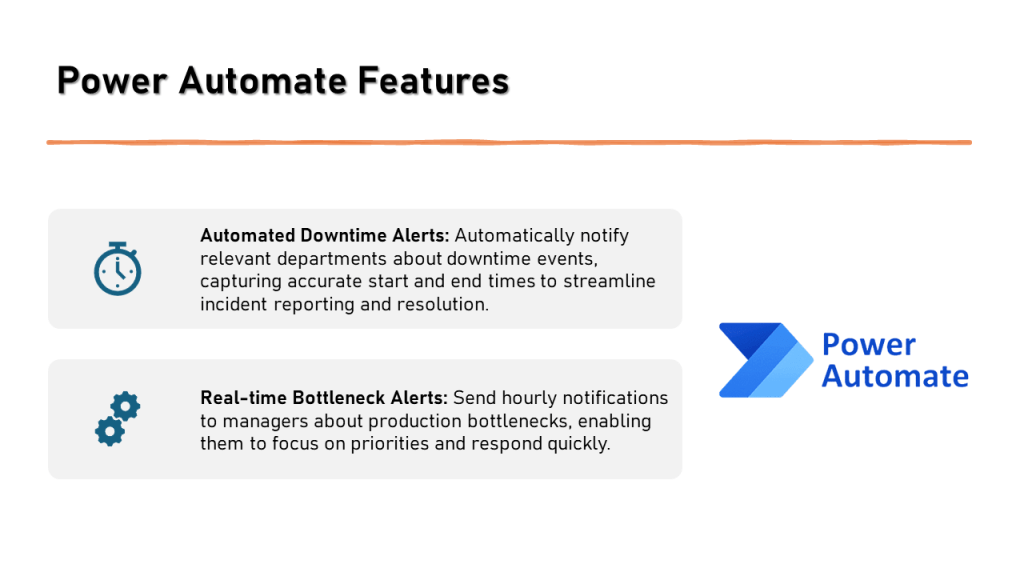
2. Power Automate: Automated Report Submission & Alerts
Purpose: Automatically inform managers about production issues and deliver reports in real-time, speeding up decision-making.
Development: Set up an Instant Flow in Power Automate, triggered by a button in the Power App:
- Hourly Alerts: Supervisors can send the latest production status directly to management with a click. If certain thresholds (e.g., low productivity or high defect rates) are met, automatic notifications are sent to the concerned manager via email or Teams.
- Bottleneck Alerts: If a bottleneck is identified (e.g., machine downtime exceeding 30 minutes), the flow can automatically escalate the issue to senior management, ensuring faster responses.
Benefits:
- Eliminates the need for supervisors to physically search for managers to report problems.
- Ensures that bottlenecks are addressed promptly, minimizing production delays.
- Automates the flow of real-time data for faster decision-making.
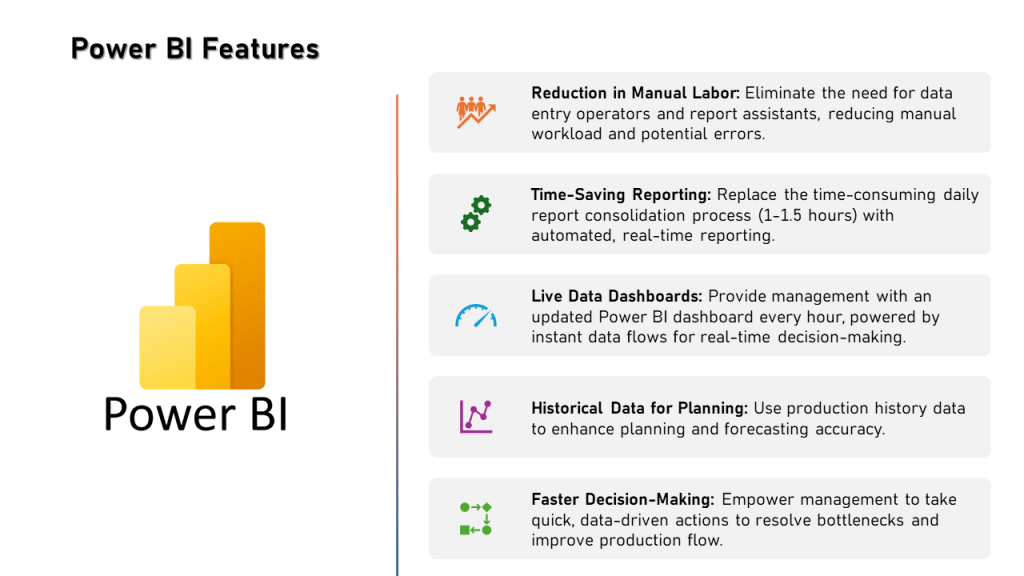
3. Power BI: Real-Time Data Dashboards & KPI Monitoring
Purpose: Give management visual insights into production efficiency, bottlenecks, and overall performance using real-time data.
Development: Use Power BI to create dashboards that pull data from Dataverse (where the Canvas app stores the information) to visualize KPIs like:
- Efficiency, productivity, defect rates, and downtime across different sewing lines.
- Department-wise performance metrics (e.g., machine maintenance, quality control).
- Bottleneck analysis and production trends.
Access:
- Senior and top management can access these dashboards at any time to check factory performance.
- Historical data allows management to forecast production, find recurring issues, and improve processes.
Benefits:
- Reduces the time needed to prepare reports, as the data is instantly available.
- Allows management to track performance in real time and make informed decisions based on precise data.
- Provides a holistic view of the factory’s performance, integrating data from multiple departments.
Final Outcome:
By integrating Power Apps, Power Automate, and Power BI, the factory gains a real-time, automated production monitoring system. This solution minimizes manual work, accelerates decision-making, and improves overall efficiency, productivity, and accuracy in reporting.

Leave a Reply